SurveyMonkey Enterprise og Tableau
Forbind SurveyMonkey med Tableau for at få et 360-graders overblik over din medarbejderoplevelse, tendenser i kundesupport og meget mere.

Anvendes af 300.000 organisationer i hele verden, herunder 95 % af Fortune 500-listen





Se den kombinerede fordel ved SurveyMonkey og Tableau for dybere indsigt
Træf bedre beslutninger med et holistisk billede af dine data
- Synkroniser resultater fra enhver spørgeundersøgelse for at få tidssvarende indsigter.
- Få et 360-graders overblik over dine kunder, dit marked og meget mere ved at kombinere operationelle data med feedbackdata.


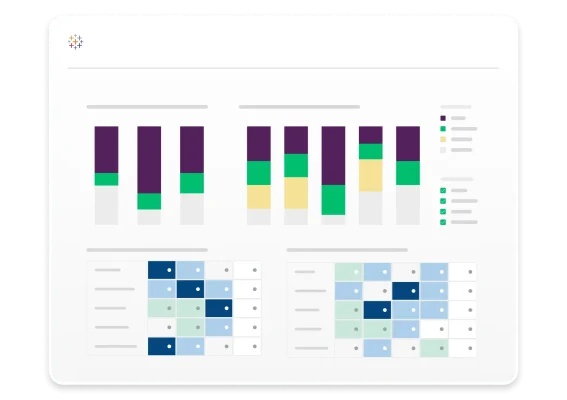
Få dybere indsigt gennem signifikante visualiseringer
- Udnyt den fulde effekt af Tableaus markedsførende analysemuligheder til at afdække tendenser og muligheder.
- Opret dashboards til at sammenligne feedback over tid, og gå i dybden med parametre såsom størrelse eller geografi.
Gør datadeling og samarbejde bedre
- Centraliser og standardiser, hvordan du deler indsigter med vigtige interessenter.
- Giv hele din organisation – fra analytikere til ledere – mulighed for at handle.
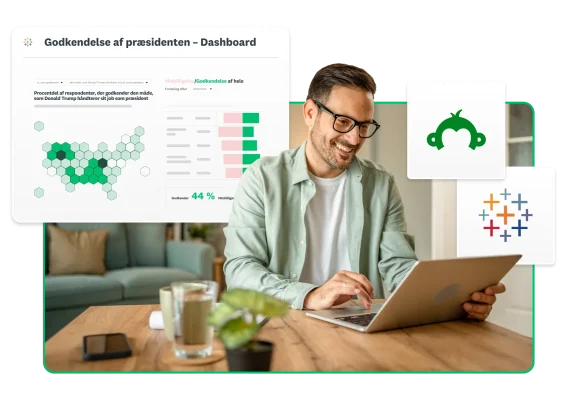
Find ud af, hvordan du nemt kan forbinde Tableau og SurveyMonkey
Denne integration er et betalt tilføjelsesprogram og tilbydes kun til SurveyMonkey Enterprise-kunder.
Implementeringen er enkel, du skal bare logge på din SurveyMonkey Enterprise-konto og følge den trinvise vejledning i produktet. Og hvis du har spørgsmål undervejs, er vores team her til at hjælpe med ressourcer.

“Foreningen af SurveyMonkey og Tableau øger vores teams effektivitet og evne til at samarbejde – og det giver vores bureau, og dermed for vores kunder, tidstro værdi”.
Neil Owen
Executive Vice President
Ntara
Se flere måder at få resultater på med SurveyMonkey-integrationer

5 integrationer, der hjælper dig med at finde nye indsigter
Følg med, når vi drøfter nogle af vores mest effektive integrationer, herunder Tableau.
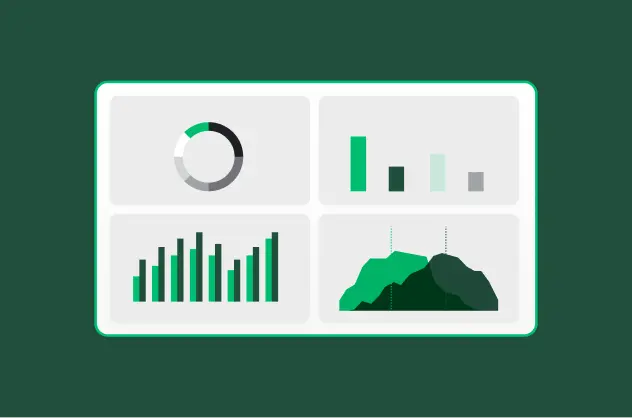
Forbind feedback og operationelle data for dybere indsigter
Find ud af, hvordan en kombination af kundeindsigter og analyseværktøjer såsom Tableau, resulterer i dybere indsigter.
Find ud af, hvordan du kommer i gang med Tableau og SurveyMonkey
Find ud af, hvordan du konfigurerer Tableau til dine spørgeundersøgelsesdata med en trinvis vejledning.

Find ud af mere om SurveyMonkey-integrationer
Få endnu mere ud af dine spørgeundersøgelsesdata med over 200 apps og plug-ins.